RSI Explained: What Is a Good RSI?
What the Relative Strength Index really measures, how traders use it, where it breaks down, and the current RSI of any US stock, checked live.
Check the RSI of any US stock
Live from our indicators engine: the same values shown on every Bounce stock page.
Couldn't load RSI for that stock. Try another.
--
--
RSI 14, daily bars. See all indicators for this stock
Popular right now:
 NVDA RSI
 AAPL RSI
 TSLA RSI
 MSFT RSI
 AMD RSI
 AMZN RSI
 GOOGL RSI
 META RSI
 NFLX RSI
 INTC RSI
 PLTR RSI
 COIN RSI
What RSI actually measures
The Relative Strength Index, developed by J. Welles Wilder in 1978, answers one question: over the recent past, have the up-days or the down-days been winning? It compares the average size of gains against the average size of losses over a lookback window (14 periods by default) and compresses the answer into a 0-100 scale.
When RSI reads 70, recent gains have strongly dominated recent losses. At 30, the opposite. At 50, they're balanced. That's all it is: a momentum thermometer. It knows nothing about earnings, value or news; it summarises recent price behaviour, nothing more.
The classic interpretation: above 70 is overbought (the rally has been unusually one-sided and may be due a rest) and below 30 is oversold (the selling has been unusually one-sided and may be due a bounce). Those thresholds are conventions, not laws, and the section below on where RSI fails matters more than the thresholds themselves.
How traders actually use RSI
Oversold bounce (mean reversion)
Buy when RSI drops below 30, sell as it recovers toward the middle. The most common RSI strategy, and the basis of our pre-built "RSI mean reversion" strategy you can backtest on any stock below.
Overbought exit
Less about shorting, more about taking profit: RSI pushing above 70 is a common exit trigger for positions opened lower, because momentum that one-sided rarely persists without a pause.
With a trend filter
The strongest use: only take oversold signals in stocks trading above their 200-day moving average. You're buying dips in healthy stocks rather than catching knives in broken ones.
Divergence
Price makes a new low but RSI makes a higher low, so the selling is losing force even as price ticks lower. Suggestive rather than reliable; treat it as a prompt to look closer, not a signal on its own.
Where RSI breaks down
RSI is a mean-reversion tool, and it fails in exactly the conditions where the biggest money is made and lost: strong trends. In a powerful uptrend, RSI can sit above 70 for weeks while the stock keeps climbing, and everyone who shorted "overbought" got run over. In a collapse, a stock can stay below 30 all the way down.
This is why "RSI is below 30" alone is a weak strategy, and why the same RSI rule produces completely different results on different stocks. The honest way to find out whether an RSI rule works on the stock you trade is not to argue about it. It's to backtest it on that stock and read the win rate, drawdown and trade count.
Frequently asked questions
What is a good RSI to buy at?
There's no single good number. Below 30 is the classic oversold threshold, but in strong trends RSI stays extreme for weeks. It works best with a trend filter: oversold dips in stocks above their 200-day moving average, and the threshold that works is stock-specific: backtest it.
Does RSI actually work?
On its own, inconsistently: results vary widely by stock and by the rules around it. As one condition inside a tested strategy with an exit and a risk rule, it earns its place more often than most indicators.
What does the 14 in RSI 14 mean?
The lookback window: 14 daily bars, roughly three trading weeks. Shorter periods swing faster with noisier signals; longer ones are smoother and slower. Changing it changes every backtest result.
Where can I see RSI for a specific stock?
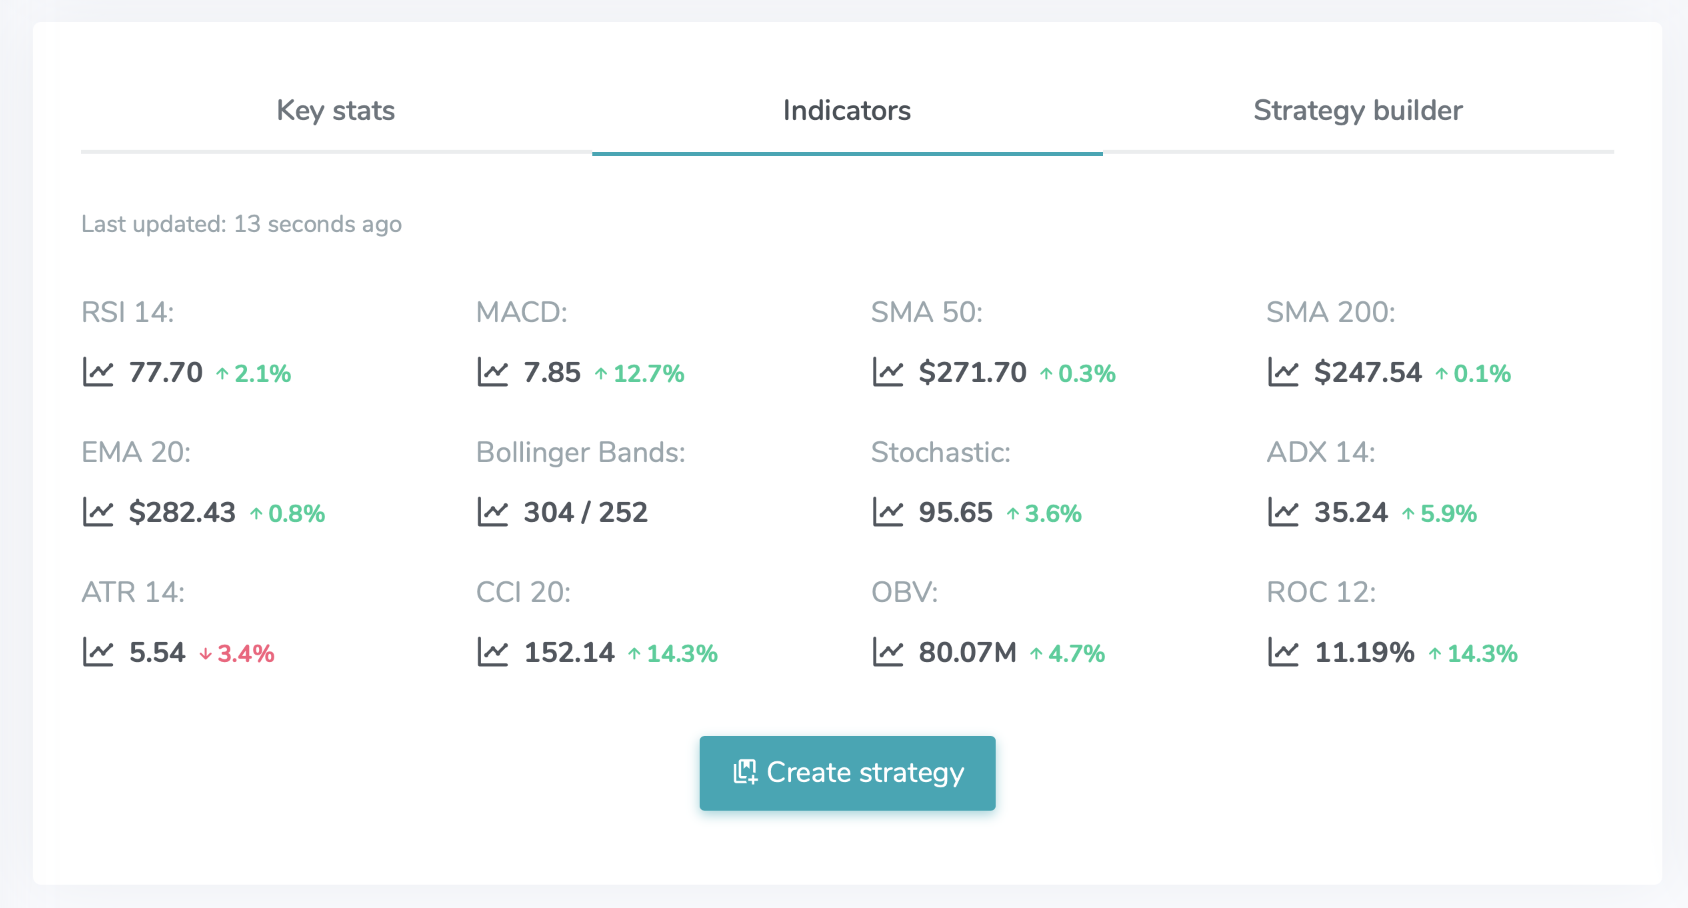
Use the checker at the top of this page, or open any stock's page. Every Bounce stock page shows RSI alongside MACD, moving averages, Bollinger Bands and more.
Stop debating RSI. Test it.
Build "RSI below 30 in an uptrend", or your own version, in the no-code builder and backtest it across 5,000+ US stocks in one run.
Start Free 14 Day Trial