SMA vs EMA: Moving Averages Explained
What the difference between simple and exponential actually is, which period to use, how traders use moving averages in practice, and where any US stock sits against its own right now.
Check any US stock against its moving averages
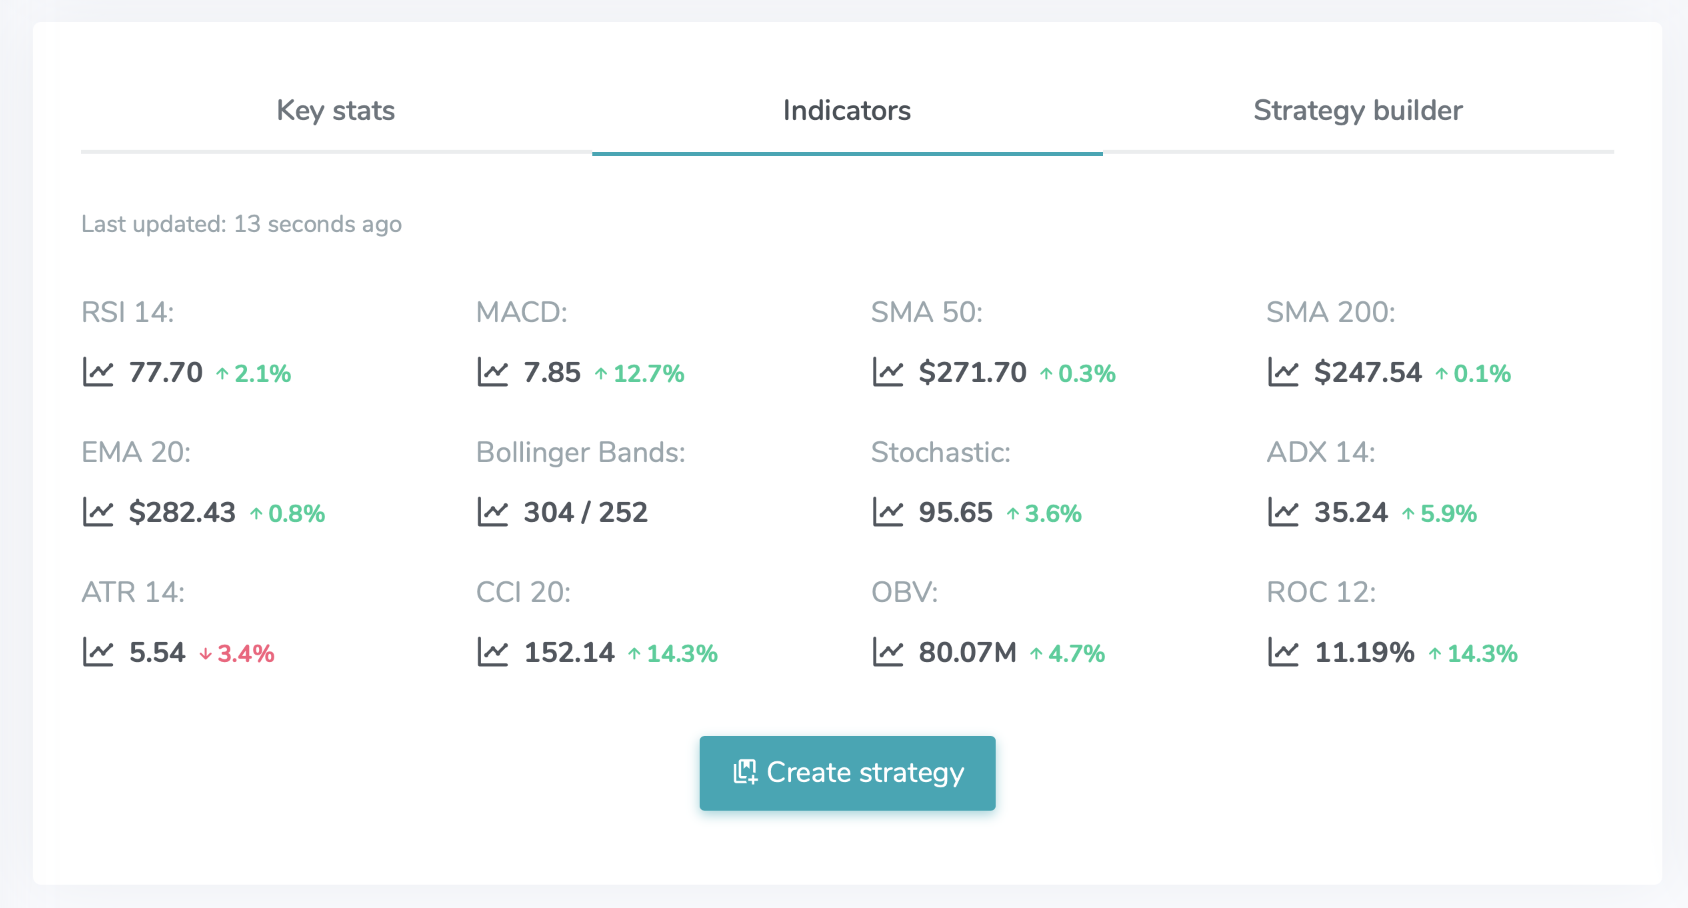
Live from our indicators engine: the same values shown on every Bounce stock page.
Couldn't load moving averages for that stock. Try another.
Popular right now:
 NVDA moving averages
 AAPL moving averages
 TSLA moving averages
 MSFT moving averages
 AMD moving averages
 AMZN moving averages
 GOOGL moving averages
 META moving averages
What a moving average actually does
A moving average is the average closing price over the last N days, recalculated every day. That's it. The 50-day moving average of a stock is what it closed at, on average, over the last 50 trading days.
Its entire purpose is to throw information away. Daily price is mostly noise: gaps, news reactions, one large seller. Averaging strips that out and leaves the direction underneath. You give up detail to see shape.
Which sets up the only trade-off that matters in this whole topic: every moving average is a choice between responsiveness and reliability. Average fewer days and you react quickly, including to things that turn out to be nothing. Average more days and you react to real changes only, but late. SMA vs EMA, 20 vs 200: every question below is a version of that same dial.
SMA vs EMA: the real difference
A simple moving average (SMA) treats every day in its window identically. In a 50-day SMA, the close from 50 days ago counts exactly as much as yesterday's.
An exponential moving average (EMA) weights recent days more heavily, with the weight decaying as you go back. Yesterday matters most, the day before slightly less, and so on. Old data never fully drops out, it just fades.
That produces two visible differences:
EMA turns sooner
Because recent prices dominate, an EMA starts bending as soon as price does. If you need to react to a change in direction quickly, an EMA gets you there first, and gets you there on false alarms first too.
SMA ignores single days
One violent day moves an SMA by a fiftieth of its size and nothing more. That makes it steadier through news spikes and earnings gaps, at the cost of being slow when a move is genuine.
There's one more difference worth knowing, because it catches people out: an SMA moves when old data leaves the window, not just when new data arrives. A 50-day SMA can drift upward on a flat day simply because the day dropping off the back was a bad one. Nothing happened today; the average moved anyway. EMAs don't have this artefact.
Neither is more accurate. They make opposite errors, and which error costs you more depends on what you're trading and how long you hold. In practice the honest summary is that period choice matters considerably more than SMA-versus-EMA: the gap between a 20-day and a 200-day is enormous, while the gap between a 50-day SMA and a 50-day EMA is usually small enough to be swamped by everything else in your strategy.
Which period should you use?
The common periods aren't magic numbers, but they do map onto recognisable horizons, and they're widely watched enough that a lot of traders are looking at the same lines.
20-day
About a trading month. Short-term momentum, and the reference point most active swing traders watch. Reacts fast, gives a lot of signals, many of which are noise.
50-day
Roughly a quarter. The intermediate trend: slow enough to ignore a bad week, fast enough to turn within a meaningful move. The most common all-purpose choice.
200-day
About a trading year. The long-term trend, and the line institutions and financial media reference most. Rarely used to time entries; heavily used to decide whether to be involved at all.
Be sceptical of anyone offering a single best period. Those numbers are almost always found by testing many and reporting the winner, which is curve fitting; the winner won because of the specific history it was tested on, and it won't repeat. A period is worth using because it matches your holding time, not because it scored well on a chart of the past.
The three jobs moving averages actually do
1. Trend filter
By far the most valuable use, and the one with the least glamour. Rather than generating trades, the average decides which trades you're allowed to take: only buy dips in stocks above their 200-day, for example. It removes candidates instead of picking them.
2. Reference level
Traders use the 50-day and 200-day as zones where pullbacks often stall, and as places to put a stop. There's real order flow behind widely-watched lines, but this works far less cleanly in advance than it looks in hindsight.
3. Building block
Half the indicator panel is made of moving averages. MACD is the gap between two EMAs. Bollinger Bands are an SMA with standard deviation around it. Understanding averages explains most of the rest.
Where moving averages break down
They are lagging by definition, and no version of them isn't. An average of the past cannot lead the present. Shorter periods and exponential weighting reduce the lag; they never remove it. Anyone selling you a "non-lagging moving average" is selling you a shorter one.
Sideways markets are where they bleed. When a stock chops around a level, price crosses back and forth over its own average constantly. Every cross is a signal, every signal is a trade, and every trade pays costs to end roughly flat. This is the single biggest cause of moving-average strategies performing well on paper and badly in an account.
And the support-and-resistance story is weaker than it looks. Charts showing a stock bouncing perfectly off its 50-day are selected after the fact; the same charts contain plenty of clean breaks straight through it. The level is worth watching. It isn't a floor.
Frequently asked questions
What is the difference between SMA and EMA?
An SMA weights every day in its window equally; an EMA weights recent days more, so it turns faster. The EMA reacts sooner to real changes and sooner to noise. Neither is more accurate: they make opposite errors, and the period you choose usually matters more than which type you pick.
Should I use the 50-day or the 200-day moving average?
They do different jobs. The 200-day describes the long-term trend and works as a filter on what you're willing to trade. The 50-day describes the intermediate trend and sits closer to timing. Many swing traders use the 200-day for what and something faster for when.
What does it mean when a stock is above its 200-day moving average?
Price is higher than the average close of the last 200 trading days, the usual shorthand for a long-term uptrend. It describes what has already happened rather than forecasting what's next, and it's most useful as a filter on other signals, not as a buy trigger by itself.
Do moving averages act as support and resistance?
Sometimes, and less reliably than hindsight suggests. Widely-watched lines do attract orders, which gives the idea a real basis, but the same averages are broken cleanly just as often. Treat them as zones of interest rather than rules.
Which moving average period is best?
There isn't one, and any specific "best" number has usually been fitted to past data. Shorter is earlier and noisier, longer is later and steadier. Match the period to your holding time, then backtest the options you're choosing between. Every Bounce stock page shows EMA 20, SMA 50 and SMA 200 live.
Which period actually works on your stock?
Build "only buy above the 200-day", or your own version, in the no-code builder and backtest it across 5,000+ US stocks in one run.
Start Free 14 Day Trial