Free Stock Backtesting Tool
See how real trading strategies performed on any US stock: win rate, total return, max drawdown and the equity curve. Then learn how to read the results like a professional.
What is backtesting?
Backtesting takes a set of trading rules (when to enter, when to exit, how much to risk) and replays them over historical price data to see how they would have performed. No opinions, no hindsight: every trade is simulated exactly as the rules define it.
That matters because most trading ideas feel good and most of them aren't. A backtest is the fastest and cheapest way to find out which is which before real money is involved. It's the difference between "I think buying dips on this stock works" and "over the last five years these exact dip-buying rules won 64% of the time with a 12% maximum drawdown".
The results on this page come from our monthly batch backtests of pre-built strategies across US-listed stocks, the same engine paying subscribers use to test their own custom rules.
Pick a stock. See what a real strategy would have done.
Search any US stock and get the full backtested results of our pre-built strategies on it. Nothing hidden, no email required.
No strategy results for NVDA yet. Try another stock.
Momentum breakout
Buys strength after consolidation
Win rate
71%
Trades
38
Total return
--
Max drawdown
--
RSI mean reversion
Buys oversold dips, quick exits
Win rate
64%
Trades
52
Total return
--
Max drawdown
--
Golden cross trend
Rides long moving-average trends
Win rate
58%
Trades
21
Total return
--
Max drawdown
--
Get the full NVDA report
Full returns, drawdowns and every strategy we've backtested on NVDA, straight to your inbox.
Please enter a valid email address.
Past performance doesn't guarantee future results.
Your NVDA report is on its way
It usually lands within a couple of minutes, with every strategy we've backtested on this stock.
Build your own version of these strategies in the no-code builder, free for 14 days.
How to read backtest results
Four numbers do most of the work. None of them means much alone. The skill is reading them together.
Win rate
The share of trades that closed profitably. A high win rate alone means little: a strategy that wins 90% of the time but loses ten times its average win on the losers still loses money. Read it together with the size of wins versus losses.
Total return
What the strategy made over the whole test period, compounded across every simulated trade. Compare it against what simply holding the stock returned over the same window before getting excited.
Max drawdown
The deepest peak-to-trough fall in the equity curve, the worst stretch you would have had to sit through. If you couldn't stomach that loss in real life, the returns are academic: you'd have abandoned the strategy at the bottom.
Trade count
How many simulated trades produced the stats. Twenty trades is a hint; a couple of hundred is evidence. Small samples make every other metric less trustworthy.
Backtest your own rules, not just ours
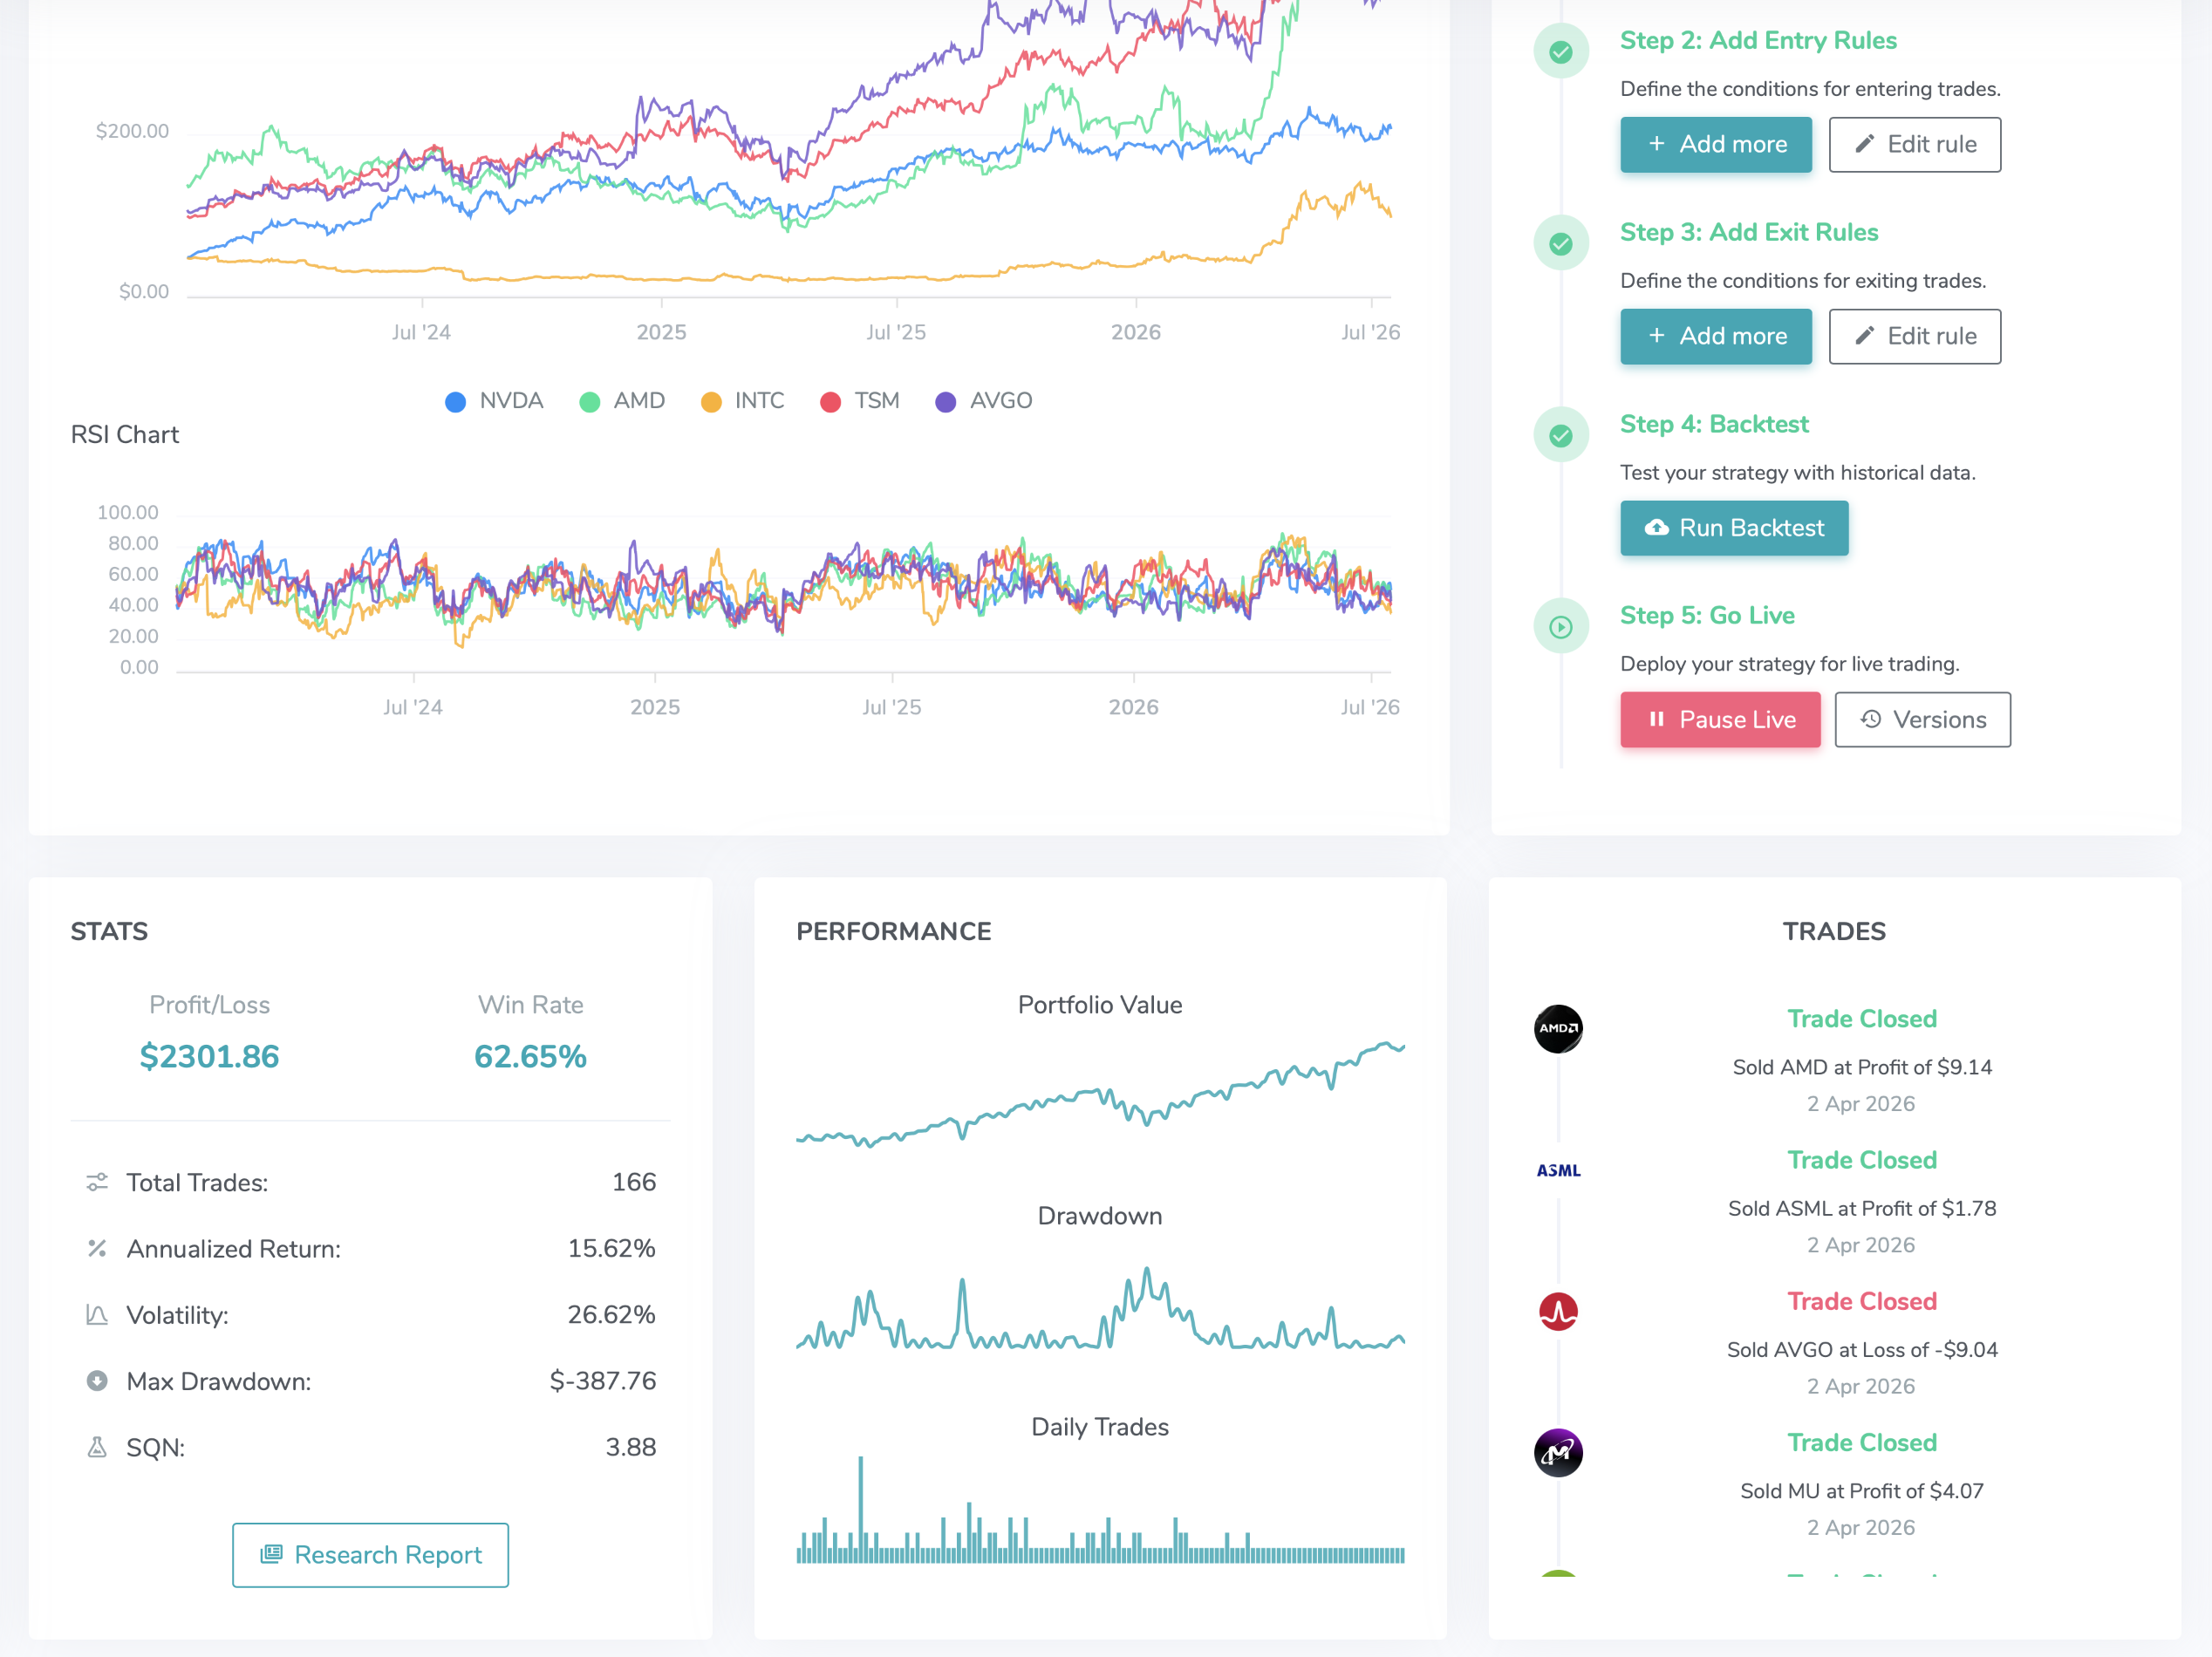
The demo above uses our pre-built strategies. The real value of backtesting arrives when the rules being tested are yours: the setup you already trade on gut feel, written down as entry, exit and risk rules and put through the same historical data. In Bounce that's a no-code builder: define the conditions, pick the stocks, and the engine simulates every trade your rules would have taken.
The limits of backtesting
A backtest tells you how rules behaved in the market that already happened. It can't know the market that comes next, and there are well-known ways to fool yourself with it:
- Overfitting. Tune rules to fit past data perfectly and they usually fit only the past. The more parameters you tweak to make a backtest look good, the less it predicts.
- Regime change. A strategy tested in a trending bull market may fall apart in a sideways or falling one. Check that the test window covers more than one kind of market.
- Costs and fills. Real trading has spreads, slippage and missed fills that idealised simulations understate, especially on thinly traded stocks.
This is why past performance doesn't guarantee future results, and why a backtest is still worth doing. It won't tell you the future, but it kills obviously broken ideas cheaply and gives you rules you've actually seen tested, which is what makes them possible to follow with discipline.
Frequently asked questions
Is this backtesting tool really free?
Yes. Searching a stock and viewing the strategy results above, including win rate, total return, max drawdown, trades and the equity curve, is free and needs no account. A free 14-day trial unlocks building and backtesting your own custom strategies.
What data does the backtest use?
Results come from our monthly batch backtests of pre-built strategies over historical daily price data for US-listed stocks, with every entry and exit rule applied exactly as defined.
Can I backtest my own strategy?
Yes, that's what Bounce is. The no-code builder lets you define your own entry, exit and risk rules and backtest them across 5,000+ US stocks, free for 14 days.
Which stocks are covered?
US-listed stocks. Browse strategy results by stock or explore the market in the free stock screener. When you're sizing the trades a strategy signals, see the position sizing guide.
Now backtest your own idea
These are our pre-built strategies. Your ideas deserve the same treatment: build them into rules and backtest them across 5,000+ US stocks, no code required.
Start Free 14 Day Trial