Stock Market Dashboard
A single pane of glass for your entire trading performance

The Bounce dashboard is a graphical user interface split into 2 main sections which give at-a-glance views of:
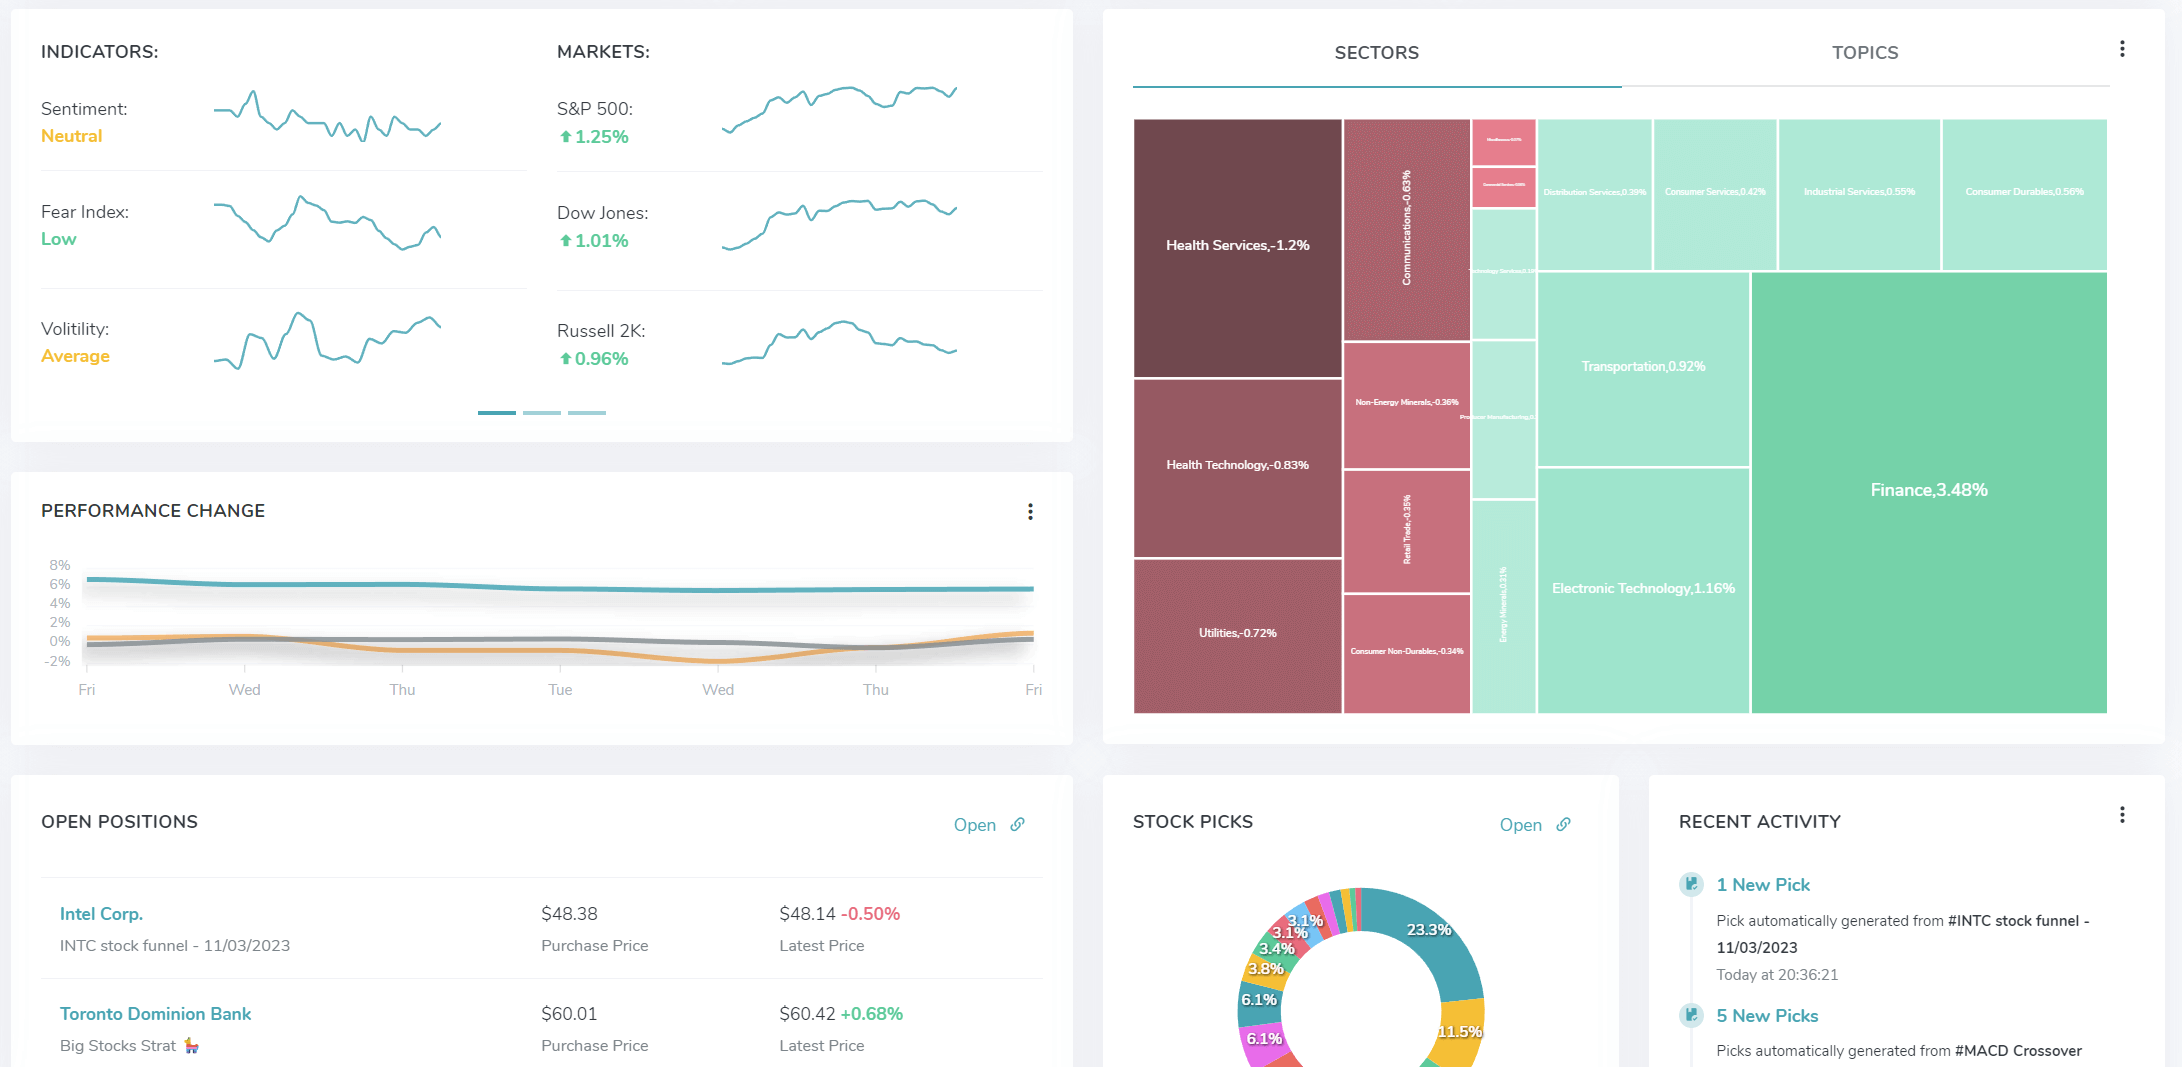
Real-time market data and profile overview
Overall it is designed to provide a platform for traders to make better, more informed, data-driven decisions. As they’re dynamic, interactive, and show near real-time data, they help you get a more precise, in-the-moment understanding of what’s happening in the world around stocks and navigate rapid, sometimes difficult changes in the market.
The Dashboard takes data from different sources and aggregates it in an easy-to-digest form so non-technical traders can more easily read and interpret it.
With interactive elements, it helps anyone using the dashboard better understand certain points, explore areas of increased interest, and support more questioning to arrive at key insights or make key decisions.
This section is useful for monitoring, and analysing relevant data in key areas. Bounce takes raw data from many sources and clearly presents it in a way that’s highly tailored to the viewer’s needs-whether you’re a new or experienced trader.
Use the dashboard data visualisation to quickly measure things like:
The Dashboard provides a summary of your strategies. Useful for monitoring and analysing performance and output.
Use this section to help understand challenges, opportunities, where to grow and make changes:
It helps you understand: what happened, why it happened, what may happen, and what action you should take. It visualises data in a way so you can quickly and easily understand the story it tells or the insights it reveals.