The Free Trading Journal Template
A ready-made template to download, what to record in it, and how win rate, R-multiples and expectancy tell you whether your trading actually works.
Why keep a trading journal?
Memory is a terrible trading record. Traders remember the great calls and quietly forget the oversized losses, which is exactly how an account bleeds while its owner feels like they're doing fine. A journal replaces that story with numbers: your real win rate, your real average loss, and whether your edge exists at all.
The pattern a journal exposes most often is the classic account-killer: many small wins erased by a few huge losses. You can't fix what you can't see, and you'll usually see it within twenty logged trades.
The template: what to record
You need ten columns, and honesty. This is the layout. Download it ready-made below, or copy it into your own spreadsheet. Or skip the spreadsheet entirely and let Bounce fill it automatically:
| Date | Symbol | Side | Entry | Stop | Exit | Shares | P&L | R | Reason / setup |
|---|---|---|---|---|---|---|---|---|---|
| 03 Jul | NVDA | Long | $142.00 | $138.50 | $149.10 | 28 | +$198.80 | +2.0R | Breakout above 20-day high |
| 08 Jul | AAPL | Long | $214.50 | $209.00 | $209.00 | 18 | -$99.00 | -1.0R | RSI oversold bounce, stopped out |
| 11 Jul | AMD | Short | $168.00 | $172.00 | $161.20 | 25 | +$170.00 | +1.7R | Failed retest of resistance |
Download the template
The stop column is the one most traders skip and the one that matters most. Without it there's no R column, and without R you can't compare a 10-share trade with a 200-share trade or compute expectancy. The reason column is what turns the journal from a ledger into a teacher. After thirty trades, group by reason and see which setups actually pay.
The two numbers that matter
Expectancy is your average result per trade: (win rate × average win) − (loss rate × average loss). Positive expectancy compounds; negative expectancy guarantees losses no matter how disciplined you are. In the sample above: two winners averaging $184, one loser at $99, so expectancy is roughly +$90 per trade. Thirty trades in, this number stops being noise and starts being the truth about your system.
Average R measures results against what you risked. A stopped-out trade is -1R; a winner that made twice its risk is +2R. If your average R is positive, your winners genuinely outweigh your losers regardless of position size. And if it's negative while your win rate looks healthy, your losers are too big. That's a position sizing problem, and it's fixable.
The honest problem with manual journals
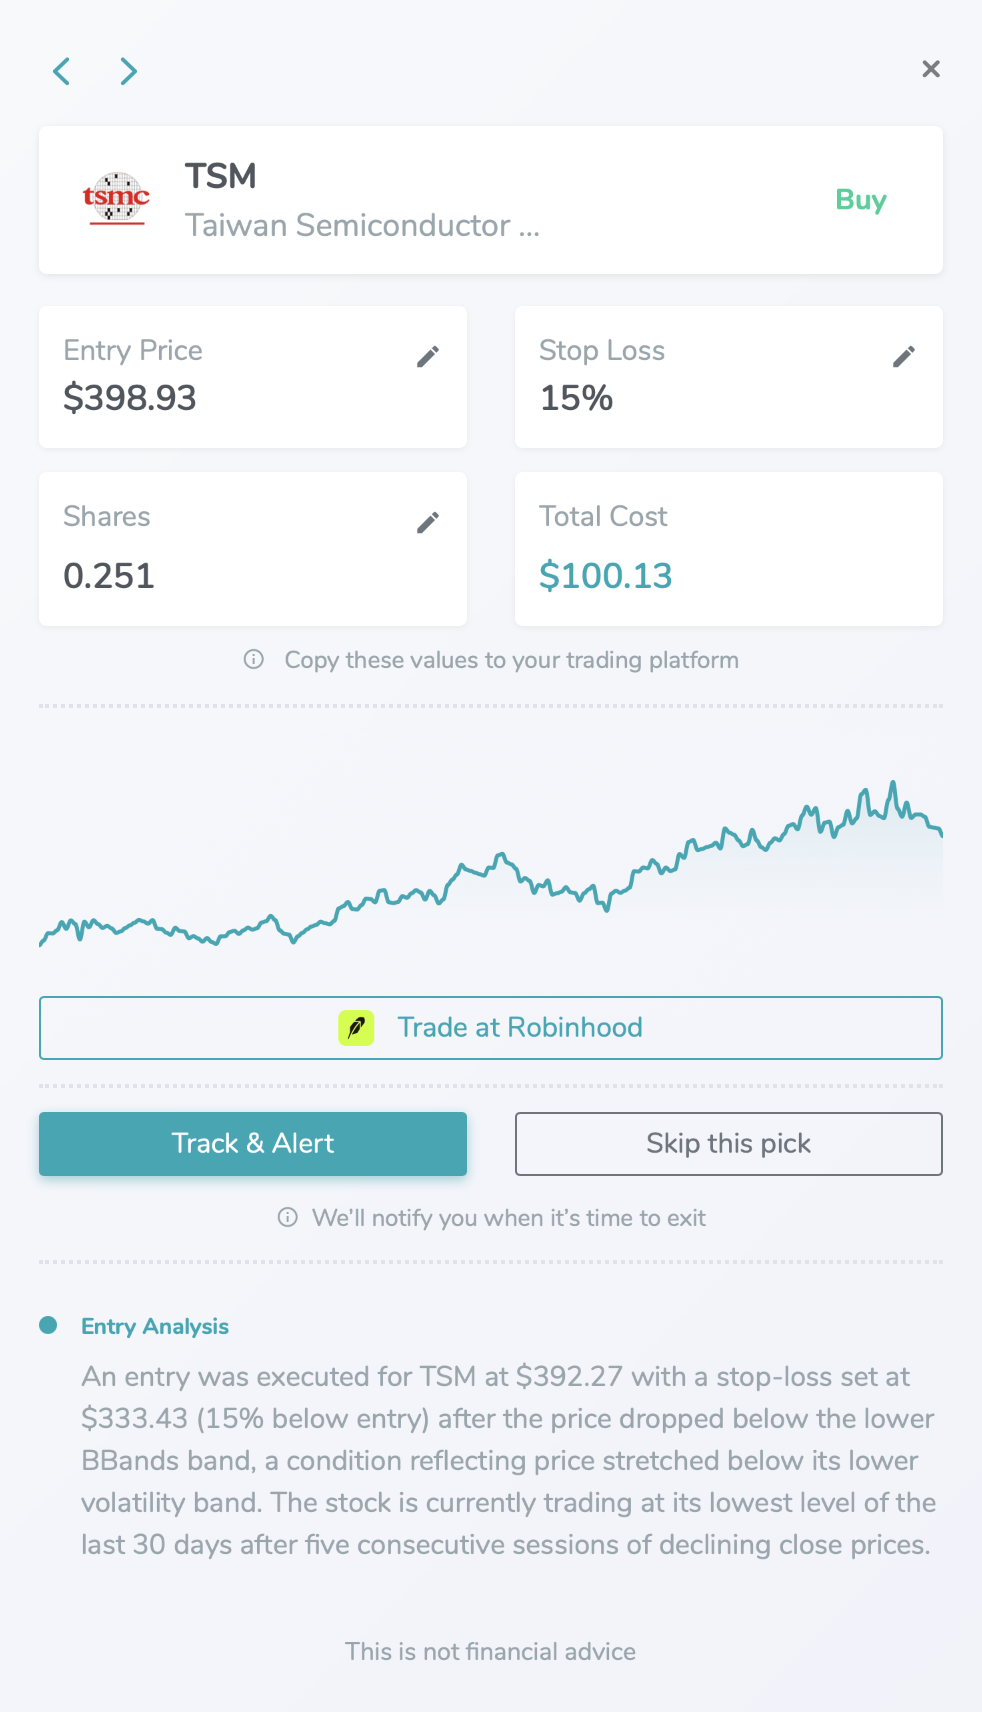
Manual journals fail the same way diets do: enthusiasm for a fortnight, then gaps, then abandonment, usually right after the losing streak you most needed to record. The journal only works if every trade goes in, including the embarrassing ones. That's the argument for automating it: when your strategy's signals and your actual trades are tracked in one place, the record keeps itself and the consistency stats (how closely you follow your own rules) come free.
Frequently asked questions
What should a trading journal include?
At minimum: date, symbol, direction, entry, stop-loss, exit, position size, P&L, R-multiple and a one-line reason for the trade. Download the free template above. P&L, R and your expectancy are already worked out for you.
What is trading expectancy?
The average amount you make or lose per trade: (win rate × average win) − (loss rate × average loss). Positive means your approach makes money on average over many trades.
How many trades before the stats mean anything?
Treat anything under 20 trades as anecdote. From 30-50 trades the win rate and expectancy start to stabilise; a hundred trades is a genuinely useful sample.
Can Bounce keep my journal automatically?
Yes. A Bounce account tracks the trades your strategies signal, how closely you follow them and your performance over time, permanently, across devices, with no manual entry.
Want this tracked automatically?
Bounce logs the trades your strategies signal, measures how closely you follow your rules and keeps your history forever. No manual entry, no lost data.
Start Free 14 Day Trial