Best Stock Analysis Sites in 2026: Top 5 Reviewed and Compared
We compared the best stock analysis sites of 2026 on research depth, charting, screening and price. Here is which one fits your investing style.
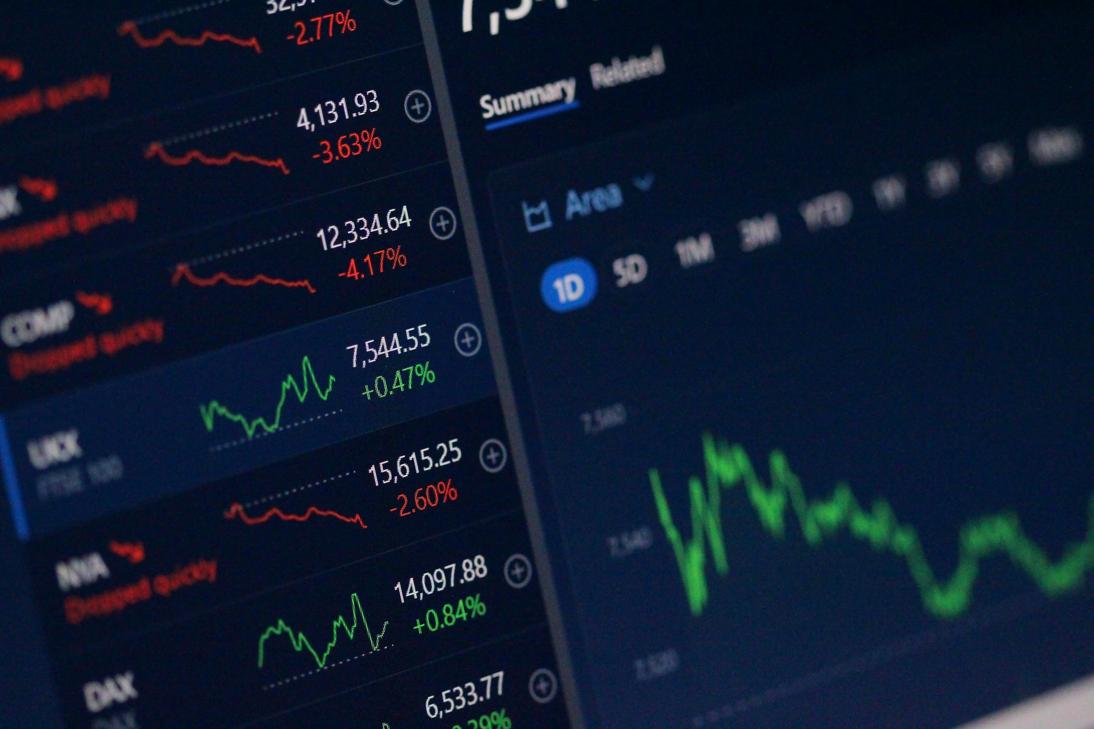
Why expert analysis matters when you invest
Every trade you place has someone on the other side of it. Quite often that someone is a desk with a Bloomberg terminal, a quant model and a research team behind them. That's the real reason the best stock analysis sites are worth your time. They close the information gap between you and the professionals, and they do it for a tiny fraction of what institutional data costs.
Good analysis does four things for a retail investor:
- It replaces opinion with evidence. Analyst notes, quant ratings and fundamental screens give you a reason to own a stock beyond "it was trending on social media".
- It counters your own bias. Confirmation bias, anchoring and revenge trading are much harder to act on when a rules-based screen or a backtest disagrees with you.
- It saves an enormous amount of time. Screening 6,000 US listings by hand isn't realistic. A good screener does it in seconds.
- It shows you the other side of the trade. The strongest research platforms publish bull and bear cases side by side, so you see the risk before you size the position.
There's data behind this too. Seeking Alpha's own backtest of its Quant "Strong Buy" ratings reports roughly 25% annualised returns since 2010, against about 10% for the S&P 500. That's a reminder that systematic, factor-driven analysis has historically beaten gut feel, though a backtest only ever describes the past.
The catch is that no single site does everything well. Charting platforms are weak on fundamentals. Screeners don't tell you why a stock passed the filter. Analyst communities give you a hundred opinions and no system. So the useful question isn't "what is the best site for stock analysis" in the abstract. It's which site fits the way you make decisions.
Overview of the top 5 stock analysis sites for 2026
We compared the leading platforms on research depth, data quality, usability and cost. Here's the shortlist before the detail:
- Bounce Trade: best all-in-one platform for turning analysis into a repeatable strategy. 14-day free trial, then $29.99/mo.
- Seeking Alpha: best for analyst opinion and quant ratings. Free tier, Premium from around $299/yr.
- TradingView: best charting and technical analysis. A free plan you can actually work with, paid from about $12.95/mo.
- Finviz: best stock screener and market visualisation. Free tier, Elite around $299/yr.
- Unusual Whales: best for options flow, dark pool prints and congressional trades. Delayed free tier, paid from about $50/mo.
Prices are correct as of August 2026 and worth re-checking before you subscribe. TradingView, for example, raised prices across every paid tier in April 2026.
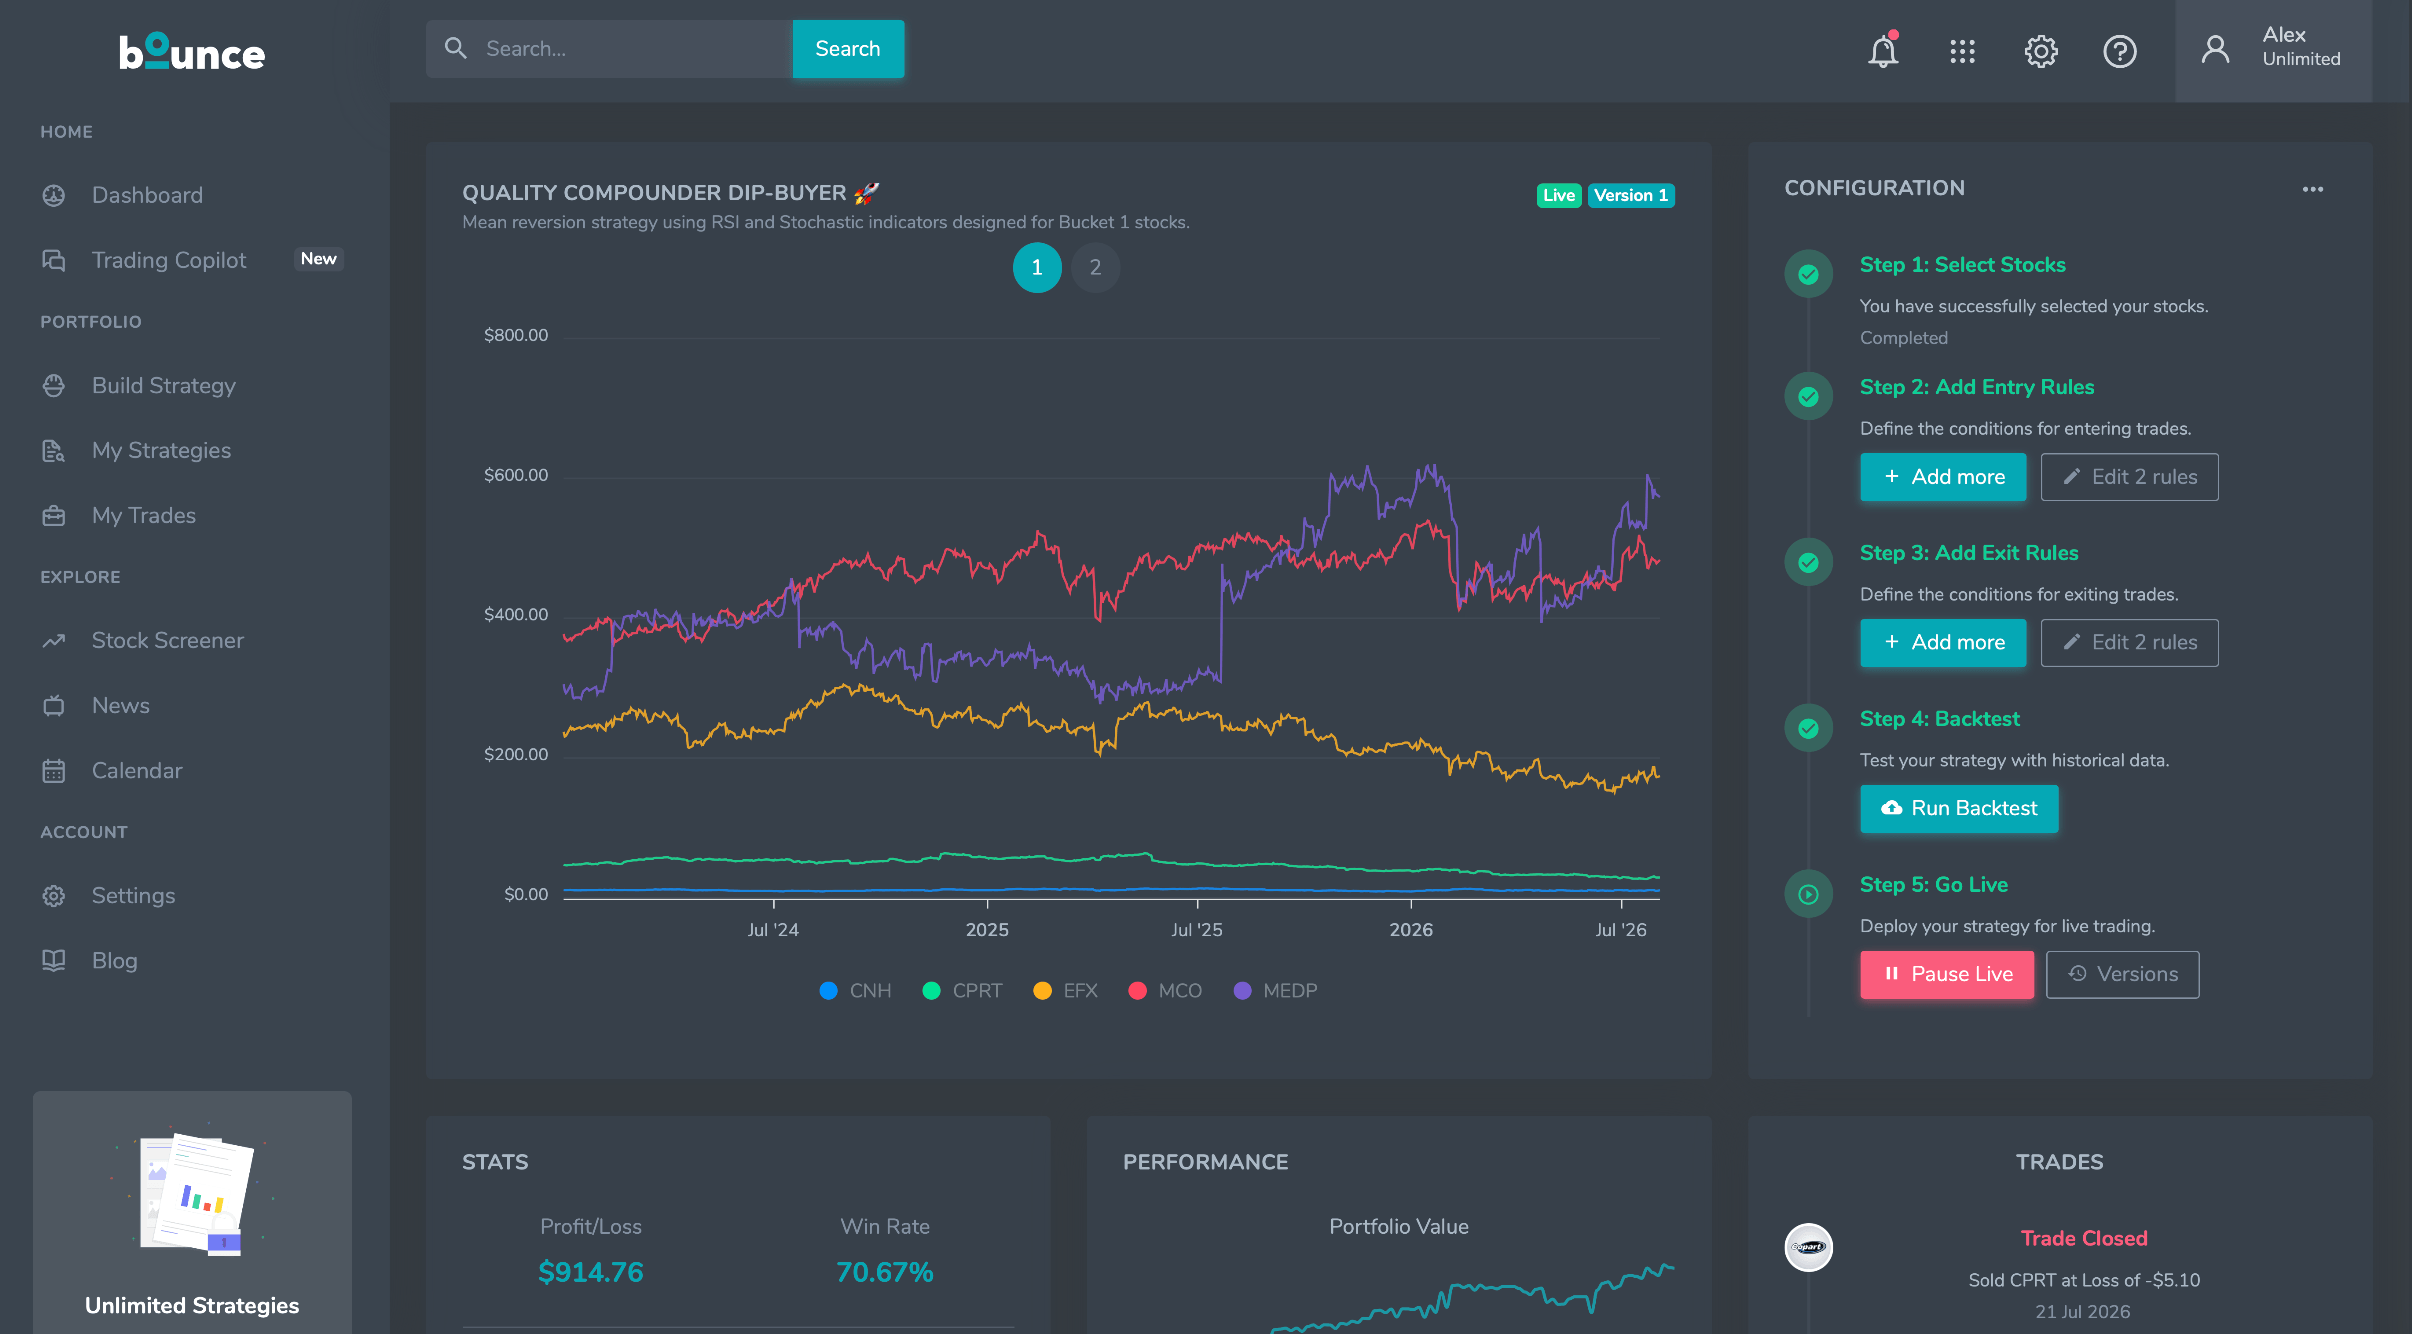
1. Bounce Trade: best all-in-one stock analysis and strategy platform
Bounce Trade sits in a slightly different place to the rest of this list. Most stock analysis sites stop at the research. They hand you a rating, a chart or a filtered list, then leave the "so what do I actually do?" part to you. Bounce is built around that next step: turning an idea into a written, testable, alertable strategy.
What you get:
- Strategy builder, so you can define entry and exit rules from technical and fundamental conditions without writing any code.
- Backtesting, to run those rules over historical data and see how the idea would have behaved before you risk capital on it.
- Stock screener and free stock picks, so you can find candidates and test them in the same place.
- Real-time alerts to your phone when a strategy triggers, so you're not tied to a screen all day.
- Market calendar, global news and per-ticker analysis pages to give each setup some context.
- A set of free trading tools and guides covering RSI, MACD, moving averages, Bollinger Bands, position sizing and a trading journal template.
Pricing: a 14-day free trial, then $29.99/mo for unlimited strategies, unlimited backtests, mobile alerts and the full research toolkit. You can cancel during the trial and pay nothing.
Best for: investors who already have ideas and want a system for testing and executing them consistently, rather than another feed of opinions.
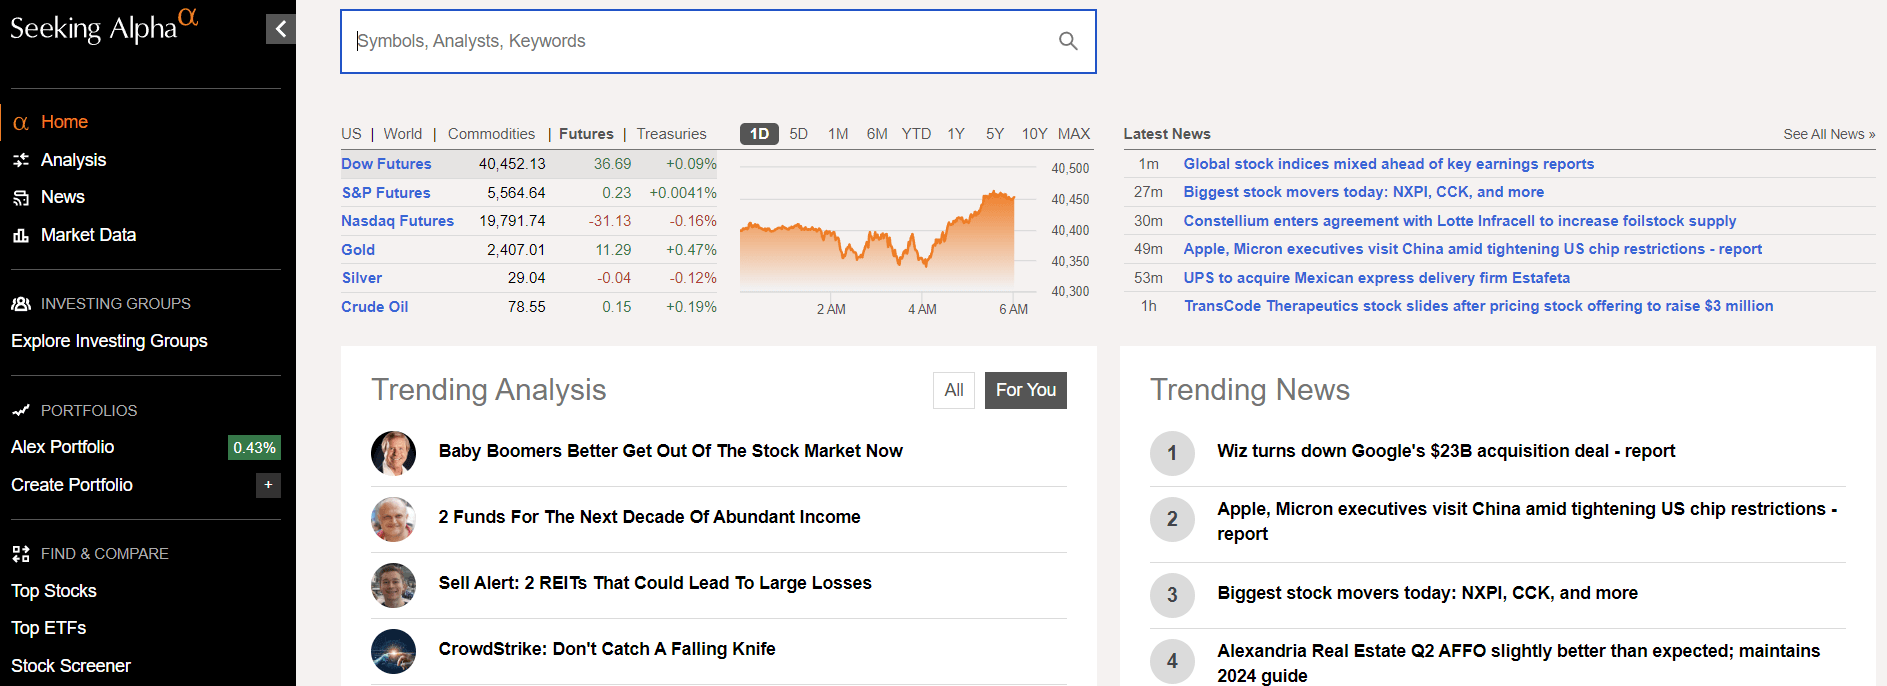
2. Seeking Alpha: best for analyst research and quant ratings
Seeking Alpha is the deepest well of written equity research aimed at retail investors. It publishes over 1,000 new articles a week from thousands of independent contributors, all passed through an editorial check, and pairs that human opinion with an algorithmic layer.
Standout features:
- Quant Ratings. More than 100 data points scored daily per stock across value, growth, profitability, momentum and revisions, boiled down to a single Strong Buy to Strong Sell grade.
- Bull and bear cases side by side. The comment threads under each article are often as useful as the article itself.
- Dividend Grades covering safety, growth, yield and consistency. This is some of the best dividend analysis you'll find at the price.
- Earnings call transcripts, Wall Street analyst consensus and a solid fundamentals screener.
Pricing: there's a limited free tier. Premium is $299/yr and often discounted to around $269, Alpha Picks is $375/yr, the Premium and Alpha Picks bundle is $545/yr, and Pro runs to roughly $1,800/yr. Premium has no monthly option.
Best for: long-term and dividend investors who want to read a thesis before they buy.
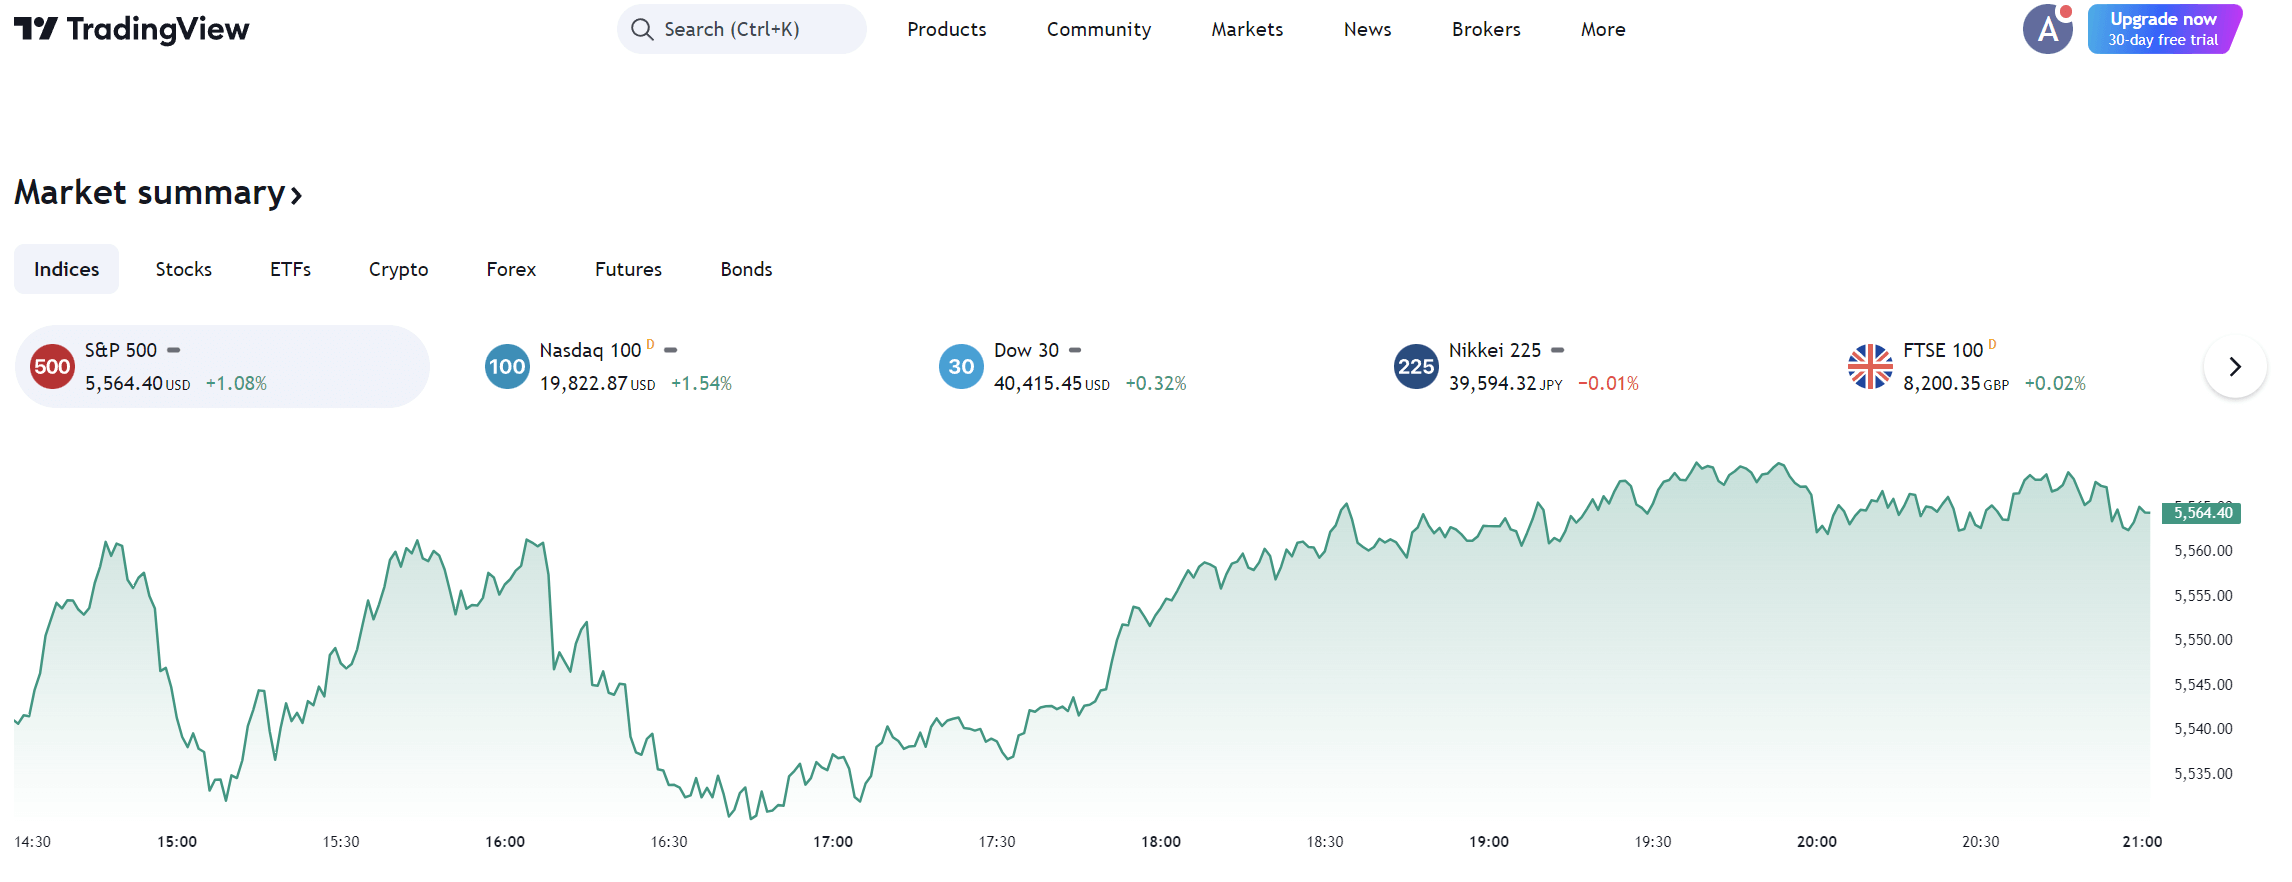
3. TradingView: best charting and technical analysis site
TradingView is the most widely used charting platform in the world, with more than 100 million users, and it's very hard to beat if your analysis starts with price action. Coverage runs from US equities to FX, futures and crypto on the same chart engine.
Standout features:
- The chart engine. Every timeframe, every drawing tool, multi-chart layouts, and it renders fast.
- Over 100,000 community Pine Script indicators, plus the option to write your own.
- Alerts on price, indicators and multi-condition logic, though the more capable alert types sit on the higher tiers.
- Paper trading and broker integrations, so you can practise a setup before funding it.
- Stock and ETF screeners, plus a large social feed of published chart ideas.
Pricing: five tiers on annual billing after the April 2026 price rise. Free, Essential at about $12.95/mo, Plus at about $29.95/mo, Premium at about $59.95/mo and Ultimate at about $199.95/mo. The free plan is usable, but you're limited to one chart per tab, two indicators and three expiring alerts, and it carries ads.
Best for: technical traders, chartists, and anyone whose decisions are driven by structure, levels and timing.
4. Finviz: best stock screener and market visualisation
Finviz has been the default free screener for a decade and it has earned that spot. Where other platforms make you click through menus, Finviz puts a dense grid of descriptive, fundamental and technical filters on one screen and returns results instantly.
Standout features:
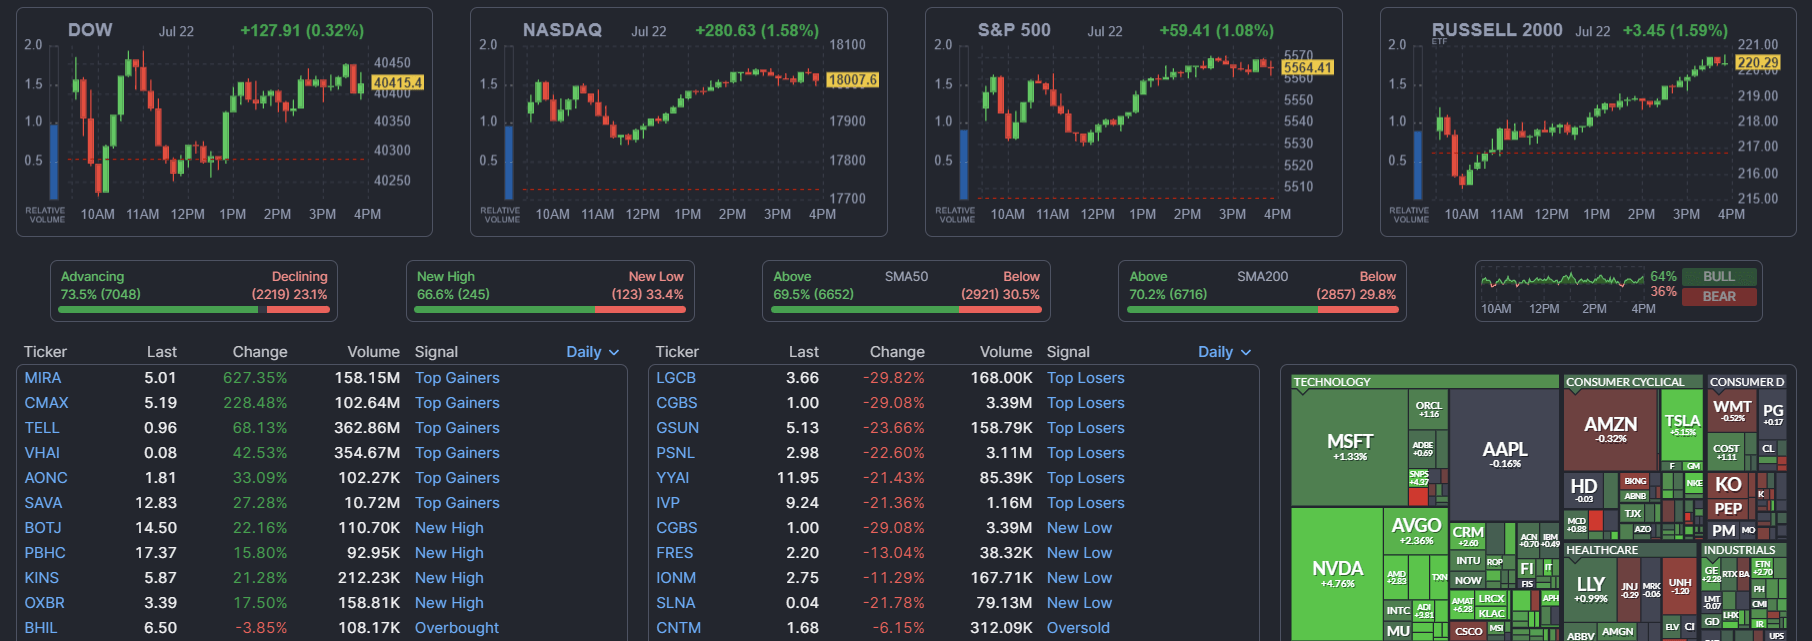
- The screener. More than 70 filters you can stack, from market cap and P/E through to RSI, relative volume and analyst recommendation.
- The market heat map, still the fastest way to read the whole market's day in one glance.
- Insider trading and institutional ownership data attached to every ticker.
- Elite extras including real-time quotes, pre-market and after-hours data, intraday charts, CSV export and a basic backtester for simple daily-timeframe rules.
Pricing: the free tier is more than enough for delayed screening. Finviz Elite is $39.50/mo or $299/yr, which works out at roughly $25/mo annualised, with a 30-day money-back guarantee.
Best for: idea generation. Use Finviz to narrow 6,000 stocks down to 20, then take those 20 somewhere with deeper analysis.
5. Unusual Whales: best for options flow and smart-money tracking
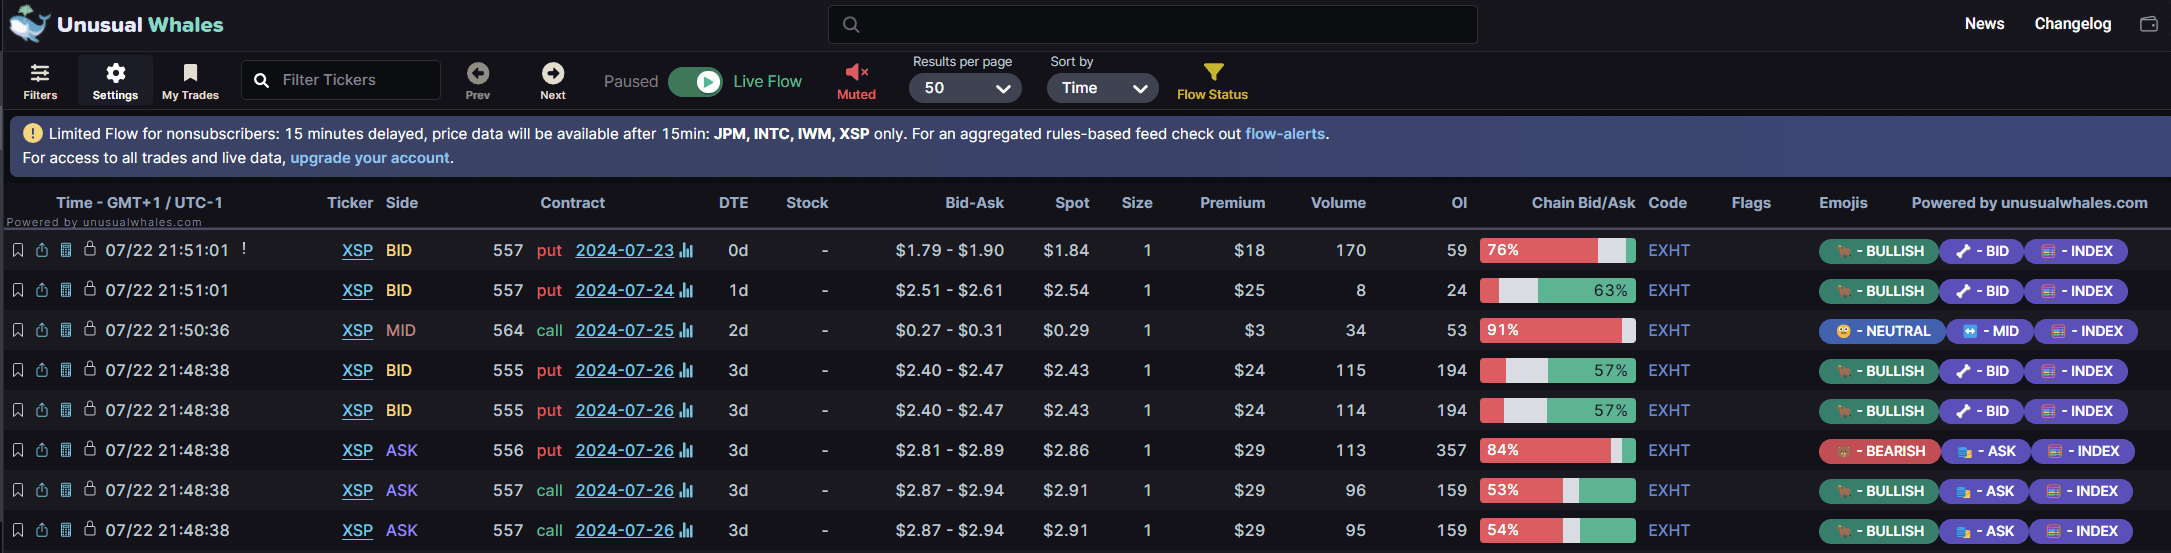
Unusual Whales answers a question the other four can't: what is large capital actually doing right now? It surfaces unusual options activity, dark pool prints and disclosed politician trades in a single interface.
Standout features:
- Real-time options flow with filters for premium size, sweeps, unusual volume and open interest changes.
- Dark pool prints shown per trade with the national best bid and offer at execution, plus reporting-facility timestamps.
- Congressional trade tracking, the feature that made the platform famous.
- Alerts, a Discord bot, portfolio tools and API access on the higher plans.
Pricing: there's a free tier with 15-minute delayed prints and capped flow. Paid plans start at around $50 to $60/mo.
Best for: active options traders, and anyone who wants a sentiment read based on positioning rather than commentary. It's the most specialist tool here, and the least useful if you're a buy-and-hold investor.
Comparing the top stock analysis sites: pros and cons
| Site | Best for | Free access | Paid from |
|---|---|---|---|
| Bounce Trade | Strategy building & backtesting | 14-day free trial | $29.99/mo |
| Seeking Alpha | Analyst research & quant ratings | Limited | ~$299/yr |
| TradingView | Charting & technical analysis | Yes, full chart engine | ~$12.95/mo |
| Finviz | Screening & market visualisation | Yes, delayed data | ~$25/mo annual |
| Unusual Whales | Options flow & dark pool data | Yes, 15-min delayed | ~$50/mo |
Bounce Trade. Pros: research, screening, backtesting and alerts in one place, strategy rules you can test before committing money, and a 14-day trial long enough to test an idea properly. Cons: focused on US equities, so it's less suited to pure options or FX traders.
Seeking Alpha. Pros: huge depth of written research, quant ratings that take emotion out of the call, and excellent dividend data. Cons: annual billing only on Premium, contributor quality varies, and there's almost no charting.
TradingView. Pros: the best charts anywhere, an enormous indicator library, and a free plan you can work with. Cons: thin on fundamentals, the useful alert types sit on higher tiers, and prices went up in 2026.
Finviz. Pros: the fastest screener on the internet, a strong free tier, and a heat map nobody has really improved on. Cons: dated interface, free data is delayed, and the backtester only handles simple daily rules.
Unusual Whales. Pros: institutional-grade flow data at a retail price, congressional tracking, and strong alerting. Cons: the most expensive per month, a steep learning curve, and flow data is easy to misread as a signal on its own.
How to choose the best stock analysis site for your needs
Match the tool to how you actually invest:
- Long-term investor or dividend focus? Start with Seeking Alpha for the thesis and Finviz to find candidates.
- Swing or technical trader? TradingView for the chart, Bounce Trade to turn the setup into a rule you can backtest and get alerted on.
- Options trader? Unusual Whales for flow, paired with a charting platform for entries.
- Complete beginner? Stay on free tiers for three months. Bounce Trade's free tool guides plus Finviz's free screener will teach you more than a $300 subscription you don't yet know how to use, and you can run the Bounce Trade trial once you have an idea worth testing.
- Getting inconsistent results despite doing the research? That's rarely an information problem. It's usually a process problem, which points to a strategy builder and a trading journal rather than another data feed.
Most serious investors end up running two platforms: one to find and validate ideas, and one to execute them consistently. The mistake is paying for five overlapping subscriptions before you know which part of your process is actually weakest.
Frequently asked questions
What is the best site for stock analysis?
There's no single winner. For written analyst research it's Seeking Alpha, for charting it's TradingView, for screening it's Finviz, for options flow it's Unusual Whales, and for building and backtesting a repeatable strategy it's Bounce Trade.
Is there a genuinely free stock analysis site?
Yes. Finviz and TradingView both have free tiers that do real work rather than just teasing an upgrade, and Bounce Trade's tool guides and stock picks are open to everyone, with a 14-day free trial on the full platform. Free data is usually delayed by 15 minutes, which matters for day trading and doesn't matter at all for position trading.
Are paid stock analysis sites worth it?
Only once you know what you'd do with the extra data. Real-time quotes, unlimited alerts and backtesting pay for themselves if you trade regularly. If you place four trades a year, the free tiers are plenty.
Which stock analysis site is best for beginners?
One with structure built in. Beginners are usually short of process, not information, so a platform that makes you write down entry and exit rules and then shows you how they performed historically is worth more than a firehose of ratings.
Conclusion: pick the site that fits your process
The best stock analysis site is the one that fixes the weakest link in how you invest. If you're guessing at valuation, Seeking Alpha closes that gap. If your entries are sloppy, TradingView does. If you can't find ideas, Finviz does. If you can't see where the money is going, Unusual Whales does.
And if you have the research but not the discipline, good ideas paired with inconsistent execution, then the gap is process. That's what Bounce Trade was built for. Define the rules, backtest them against real market history, get alerted when they trigger, and trade with a plan instead of emotion. You can start with a 14-day free trial, then it's $29.99/mo.
Pricing and features are accurate as of August 2026 and change often, so check each provider's site before subscribing. This article is for information only and is not investment advice. Past performance, including backtested performance, does not guarantee future results.
Start trading with structure
Try Bounce free for 14 days. Build a strategy, backtest it, and track how you actually trade.
Start Free 14 Day Trial